2D Resolution Independent Kelvin-Helmholtz Test
This test highlights the ability of a code to resolve mixing caused by shear flows, emphasizing the importance of an efficient, high order reconstuction method and a fast code. In general, the level of mixing would increase with the resolution; however, this is a resolution independent version inspired by the test presented in Robertson et al. 2010. The test consists of a region of higher density (100) sandwiched between two regions of lower density (1.0). The high density layer has a velocity of 10.5 and the low density layers have a velocity of 9.5. Pressure is set to 2.5 and a 1% pertubation (amplitude of 0.1) is added to the high density layer to provoke the instability. Gamma is set to 1.6666666666666667. This test is performed with the default hydro build (cholla/builds/make.type.hydro) and Van Leer integrator. Full initial conditions can be found in cholla/src/grid/initial_conditions.cppunder KH_res_ind().
This parameter file can be found at: (examples/2D/KKH_res_ind_2D.txt)
Parameter File:
#
# Parameter File for the 2D resolution independent Kelvin-Helmholtz test.
#

######################################
# number of grid cells in the x dimension
nx=128
# number of grid cells in the y dimension
ny=128
# number of grid cells in the z dimension
nz=1
# final output time
tout=2.0
# time interval for output
outstep=0.01
# value of gamma
gamma=1.6666666666666667
# name of initial conditions
init=KH_res_ind
# domain properties
xmin=0.0
ymin=0.0
zmin=0.0
xlen=1.0
ylen=1.0
zlen=1.0
# type of boundary conditions
xl_bcnd=1
xu_bcnd=1
yl_bcnd=1
yu_bcnd=1
zl_bcnd=0
zu_bcnd=0
# path to output directory
outdir=./
Upon completion, you should obtain 201 output files. The initial and final densities for two different resolutions (in code units) of a slice along the y-midplane is shown below. Default resolution (128x128) is compared to a high-res version (256x256). Examples of how to plot projections and slices can be found in the General 2D plotting example.
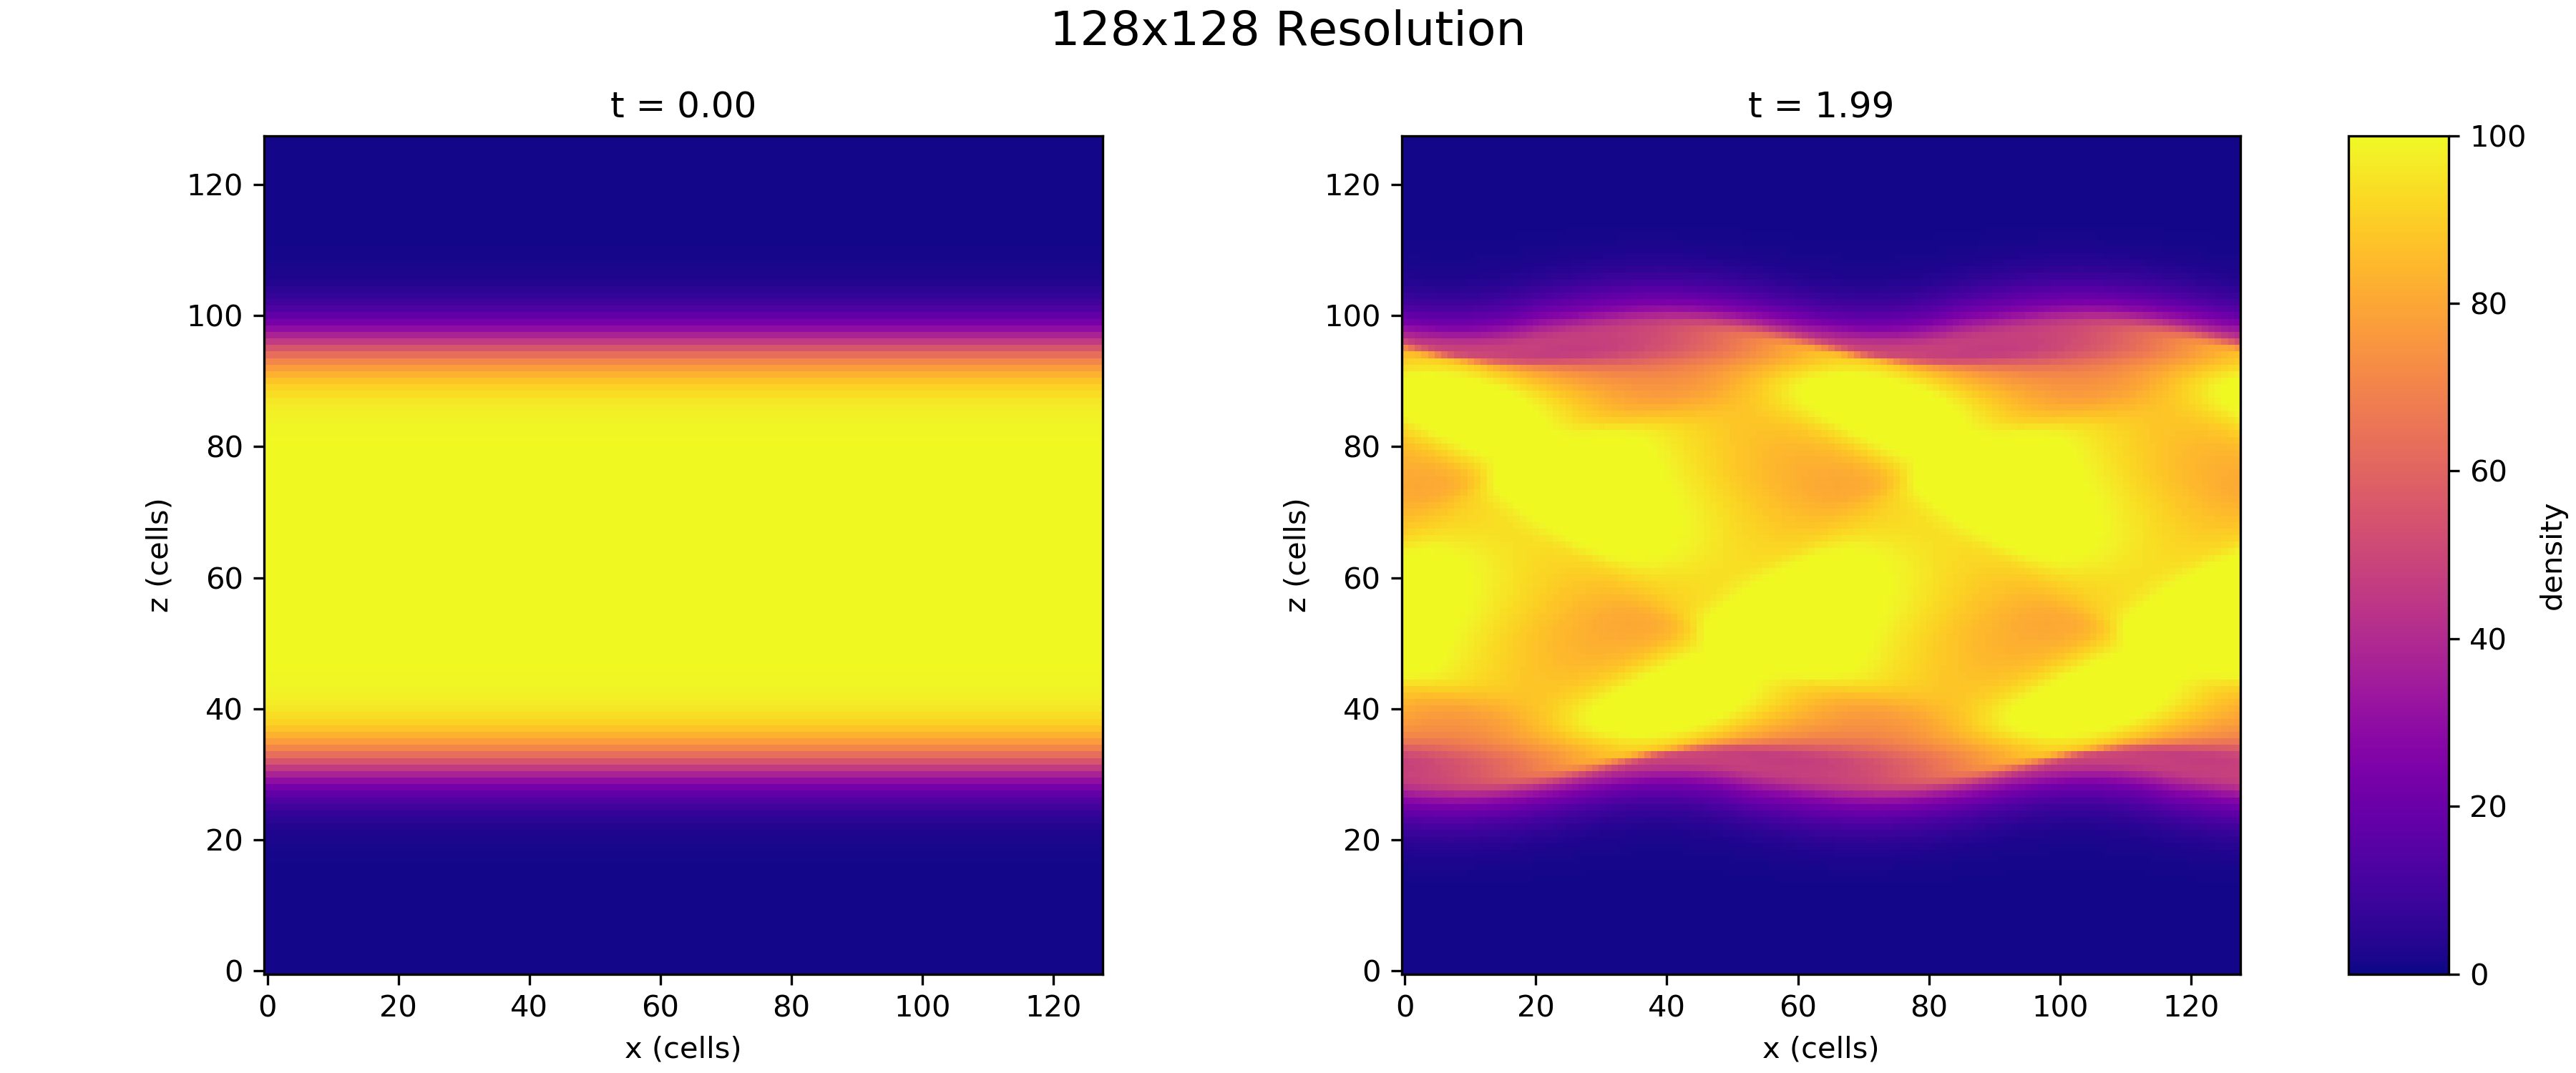
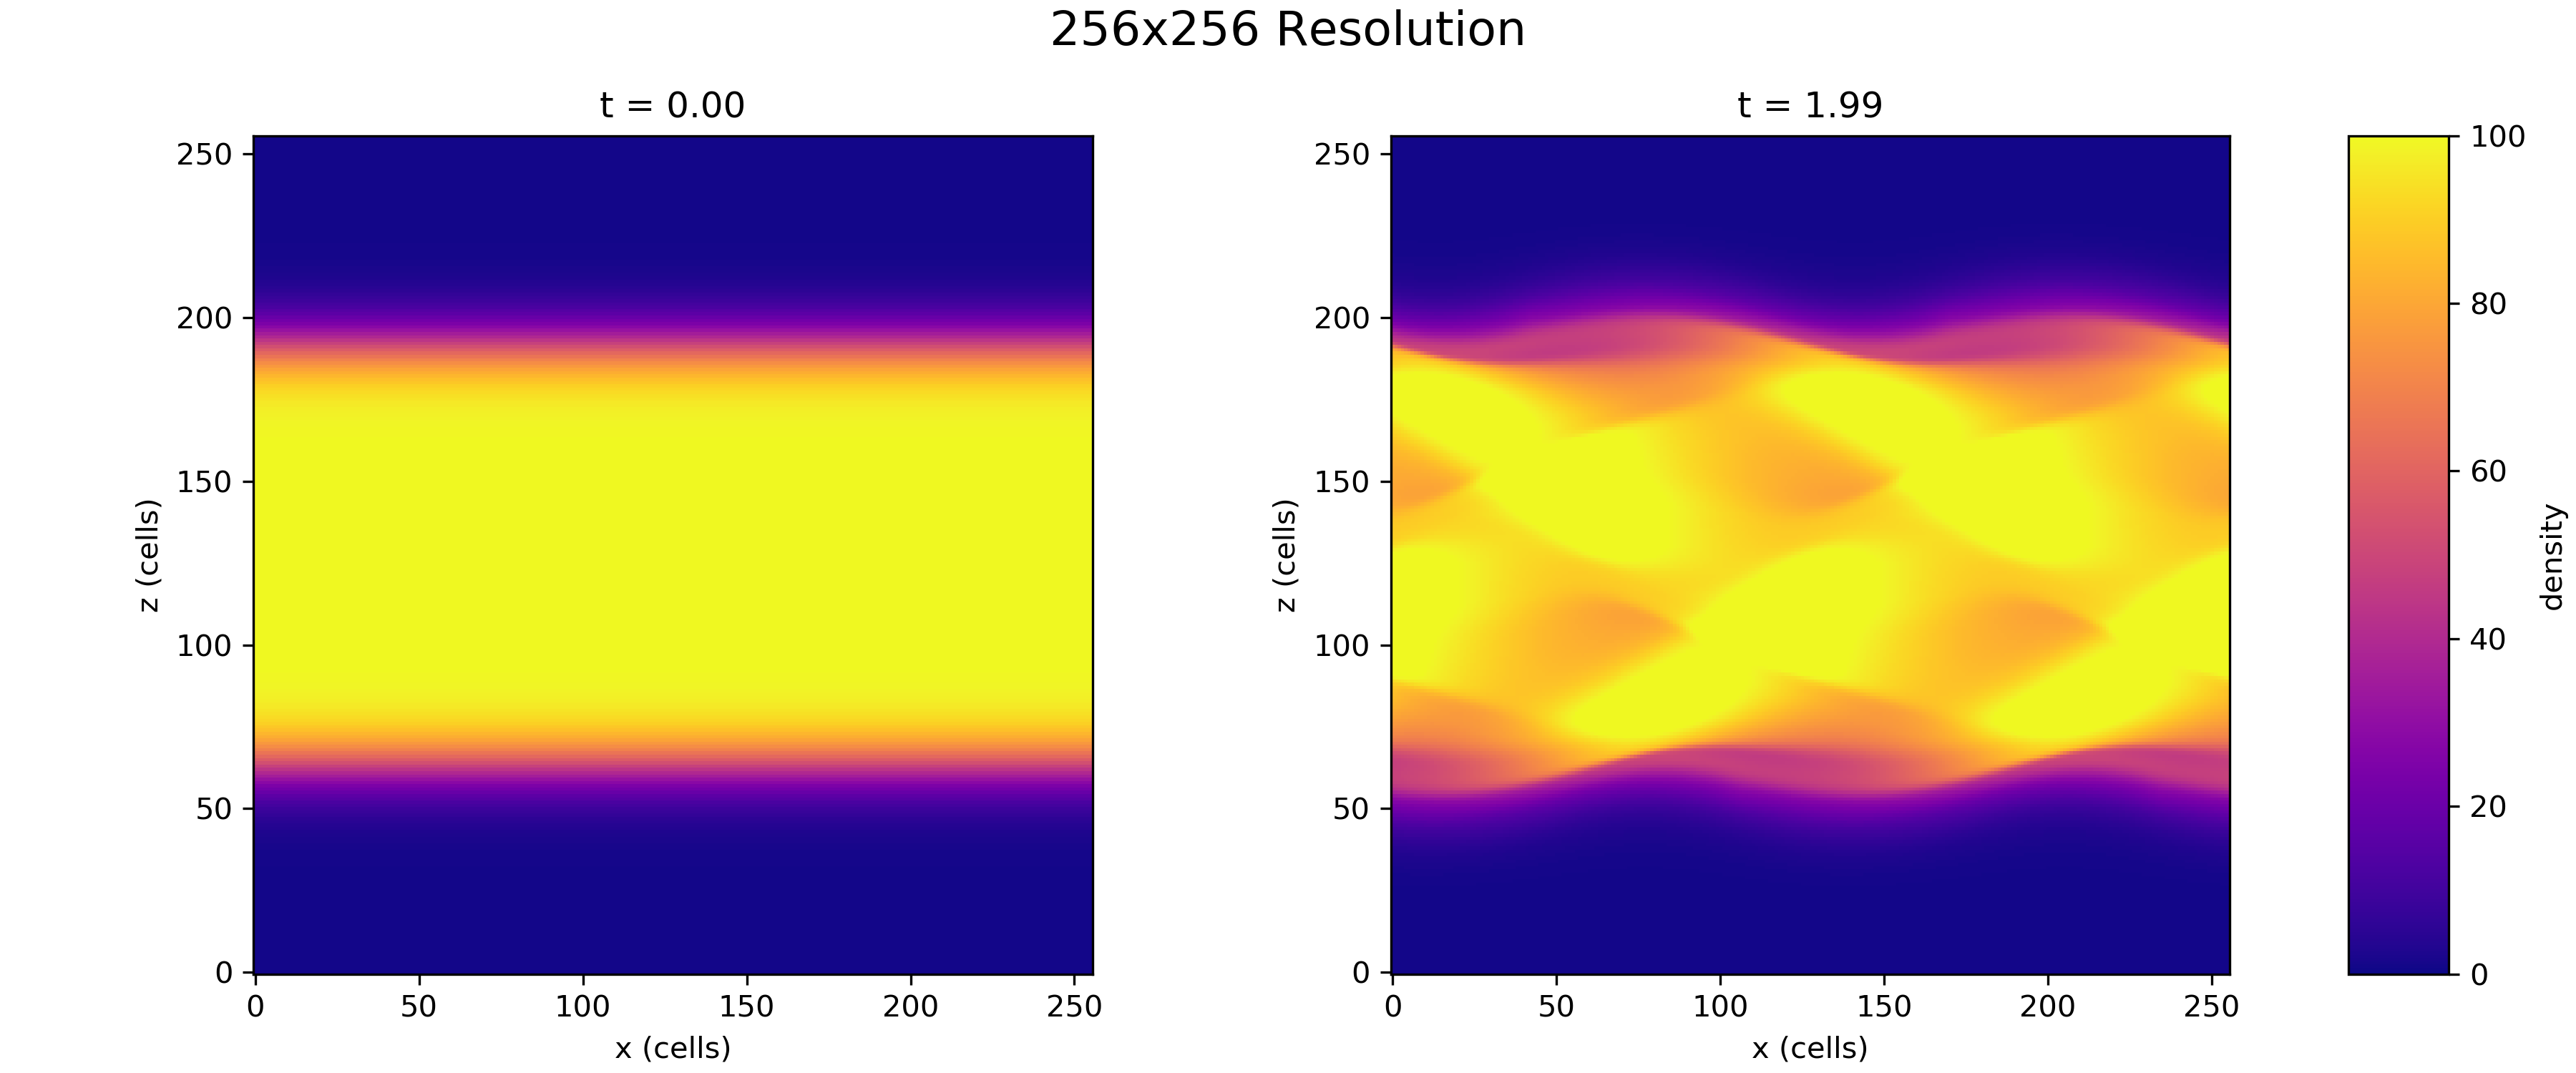
The solution does appear to be independent of resolution. We can also compare the time evolution of the density at the above resolutions.
128X128
256X256
The evolutions are almost identical during the linear regime.